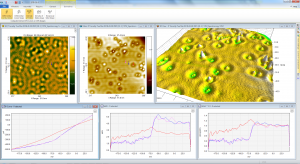
The Grid Spectroscopy (CITS) Module in SPIP™ provides unique tools for fast and easy navigation, exploration, and analysis of STM grid spectroscopy data, and is a must-have for STM users.
Grid Spectroscopy
Grid spectroscopy - or Continuous Imaging Tunneling Spectroscopy (CITS) - images consist of an XY matrix of spectroscopy curves recorded by an STM.

Grid spectroscopy (CITS) STM image of a Ag(111) surface with defects, showing the Ag surface state which sets in at about -80 meV. The actual CITS image with 3 extracted curves and the calculated differential conductance and density of states curves shown. In addition the height image is displayed both in 2D and 3D (Courtesy: University of Würtzburg).
Navigation and curve extraction
In SPIP™ a grid spectroscopy datasets is represented as a stack of images. Pixels with the same (x,y) position in all image in the stack represents the Y values in one curve. Each image represents an X axis coordinate. SPIP™ has a powerful navigator tool for quickly browsing through layers including changing direction for bidirectional curves.
Curves can be extracted at any XY position, and as many as one wishes. The points of extraction are indicated in any related images, for example in a height image.
SPIP™ can also extract the average curve of a region, the average of all curves or the entire set of individual curves – just using one or two mouse clicks.
Image Spectroscopy Analysis
To obtain detailed information from the measured surface five different types of derivatives (dI/dV, density of states etc.) of the I(V) curves can be calculated. The calculated derivatives are live updated when the source curve is changed, for example when the extraction marker in the image is moved.
In addition to calculating derivatives of individual curves, SPIP™ will also calculate new grid spectroscopy images where all curves are derivatives of the original dataset.

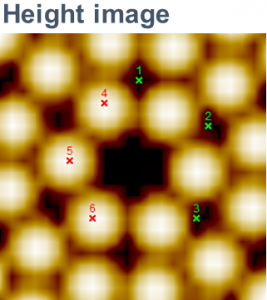
Empty states STM image of the 7x7 reconstruction of a Si(111) surface with indications of point spectroscopy positions (Omicron Nanotechnology).
Processing
In order to suppress noise SPIP™ has functions for calculating the local mean curves in the grid spectroscopy dataset. There are three options available: 3x3, 5x5, and 7x7.
As a pre-processing step for calculating derivative images SPIP™ provides compensation for any offset in the current amplifier and A/D unit in the STM electronics by setting I(0V) = 0 pA for all curves in the dataset.
Besides reducing noise by calculating the local mean curve SPIP™ can also remove noise in each extracted curve, e.g. I(V), Z(V), Aux(V), using the many filters (smootihing, median etc.) available in the Filter module when it is present.


