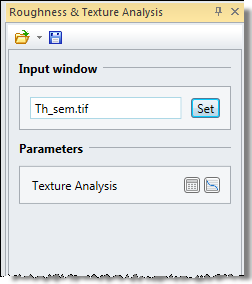
Roughness analysis and Texture Analysis are close related functions. Where Roughness Analysis can be carried out only on topographic data (height images), because roughness inherently relates to height, Texture Analysis can be carried out on all other types of images where there is no 1:1 correspondence between contrast and height. The parameters and charts in Texture Analysis are in fact a sub-set of the SPIP™ Classic Roughness parameters and charts, however with a different meaning, since the data is not height.
Details about the use of Texture Analysis which cannot be found here can be found in the section on Roughness Analysis of Images. Use of Texture Analysis with Batch Processing and Active Reporting works just as if it was Roughness Analysis for images.

For Texture Analysis there are no options for plane correcting the image. The statistical parameters and charts are calculated straight off the raw image.
The Z unit for images subject to Texture Analysis can be anything, except for length. For convenience parameter and chart names and descriptions therefore refer to the pixel Z values using the common term brightness – which will correspond to the visual brightness in the image when displayed in SPIP™ using a linear color scale where dark equals low values and bright equals high values.
For parameter descriptions please see the reference guide.

Example of an image used for texture Analysis, and two generated charts.
A subset of the charts for roughness analysis is available for texture analysis:
| Chart name | Description |
| Brightness Distribution | A chart displaying the distribution of Z values in the image |
| Angular Spectrum | An angular plot displaying the direction of texture in the image. Dominant texture directions will show as peaks in this charts |
| Parameter Bar Chart | A bar chart with visual representation of brightness parameters |
| Radial Spectrum | A scatter plot showing the amplitude of brightness as a function of wavelength in the image. This chart is generated from the 2D Fourier transform. |
| Correlation Length 20%, angular graph | An angular plot derived from the auto correlation image showing the distance from the center of the image to where the central peak has dropped to 20% of its highest value as a function of angle |
| Correlation Length 37%, angular graph | Same as above, just where the central peak has decayed to 37% (1/e) of its highest value |