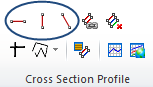
Cross section profiling is performed by marking one or more cross-section lines in an image window by use of one of the profiling tools located in the General Ribbon > Cross Section Profile Group .
By these tools you can draw one or more cross-section lines:
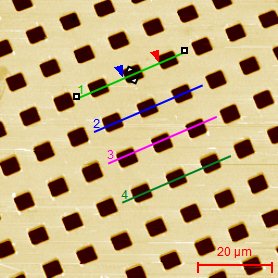
Each cross-section line will put the associated profile into the profile window belonging to the image window.
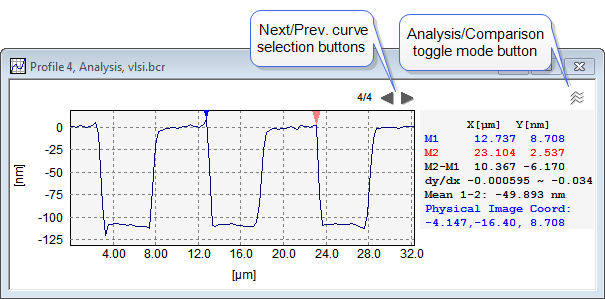
Image with cross-section lines and corresponding cross-section window shown in Analysis view
In addition the profiles will be put into the Global Profile Comparison Window where profiles from different image windows can be compared. This window may not be visible but will appear by clicking on its associated key
Initially the Cross section window will appear in Analysis View, where measurement can be performed on a selected cross-section curve by use of the cursors. When having more cross-sections in the same image you can turn the profile window into Comparison View by clicking in the toggle button upper right in the window.

Cross-section profile window shown in comparison view mode with all profiles visible.
Cross-section profiles may also be read directly from file and exist independently from an image window. In such case the profile can only be shown in the Analysis view.
To reduce the noise of a cross-section profile it might be a good idea to use averaging. In SPIP this can be done by defining an average area for the cross-section line. Within this area parallel cross-sections will be averaged
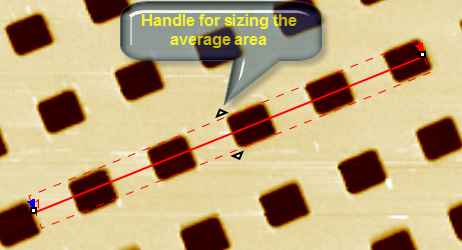
Profile averaging by interactive selection of an average area.
As described above it is possible to extract more profiles from the same image window for easy comparison. Furthermore, you may open multiple curve files and have the curves to appear in the same window if they have compatible x,, y units. This can be done by multi-selection in the file open dialog or the ImageMet Explorer or drag-dropping multiple curve files into SPIP™. When viewing the curves in Comparison View most functions for example filtering will work on the entire set of curves.