The Comparison View of the cross section window allows you to show more cross-section profiles in the same window and to manually align them so that they can be conveniently compared.
Cross section profiling is performed by marking one or more cross-section lines in an image window by use of one of the profiling tools found in the General Ribbon > Cross Section Profile Group . Initially the curves will be shown in Analysis View and you will need to toggle to the Comparison View
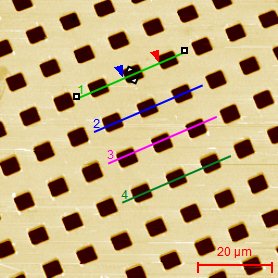
From the image you can then define one or more cross-section lines, which are automatically put into the Multi Profiling window as shown below:

Once a multi-profile line has been defined, it can be dragged, re-sized or deleted.
In the profile General Ribbon there is a single group "Comparison View Group" dedicated to the Comparison View Mode. Most other profile tools are limited to the Analysis View Mode.
This panel facilitates various handling of curve sets.
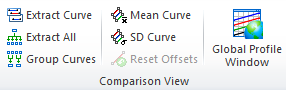
Click Extract Curve to create a new profile window containing a copy of the selected curve in Analysis View.
Click Extract All to create individual profile windows each containing one copy of the shown curves. The new windows will be shown in Analysis View.
Click Group Curves to group all compatible curves an minimizing the number of curve windows. This is useful for comparing curves in the same window and reducing the amount of windows.The function will not include curve which is connected to another window, e.g. a cross section profile connected to an image window. If this is desired you will need to create independent duplicates of the cross section profile windows, - this is done by right clicking on Duplicate in new Window or just Ctrl+D
Click the Mean Curve button to calculate the average curve of the selected ones. If none are selected the average will be calculated based on all curves.
Click the SD Curve button to calculate the standard deviation curve of the selected ones. If none are selected the curve will be calculated based on all curves.
If you have moved the curves interactively you may reposition the curves at their original positions by clicking Reset Offsets.
In the Multi Profiling window the individual curves can be put to a new position without moving the cross section line. This makes it easy to align features of interest and study their similarities in detail, see example below
|
|
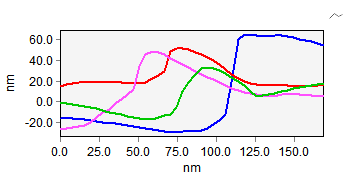
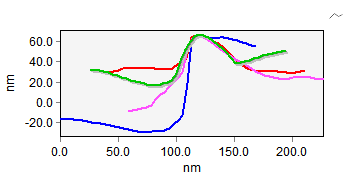
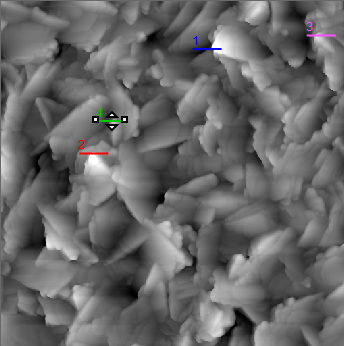
The figure demonstrates a comparison of horizontal profiles of a Tip Check sample. The top right profiles are the raw profiles as they appear for the given cross-section lines in the image. In the lower right profile window the profiles have been aligned manually so that the peaks are at same location. There is observed a high similarity close the peaks, which indicates that they are reflecting the shape of the tip used for scanning. Therefore this image may serve well for tip characterization.
Click this button to open the Global Profile Comparison Window and compare all cross-section profiles from all image windows in the same window.
While having selected at multi-profiling line the context menu of the profile can be activated by a right mouse click.
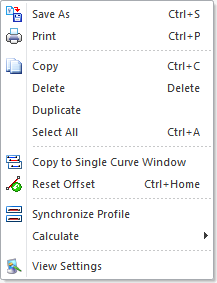
The Save As, Print, Copy, Duplicate, and View Settings menu items works on the window itself and other functions are described in the Ribbon Tools section above. Here we will only describe the other buttons.
Delete:
Removes the selected line profile(s).
Copy Curve To à Single Curve Window
Copy the selected curve to a new single curve window (a profile window without comparison view and disconnected from any images). This can be advantageous if you want to use the specialized measurement tool of the Single Curve Window.
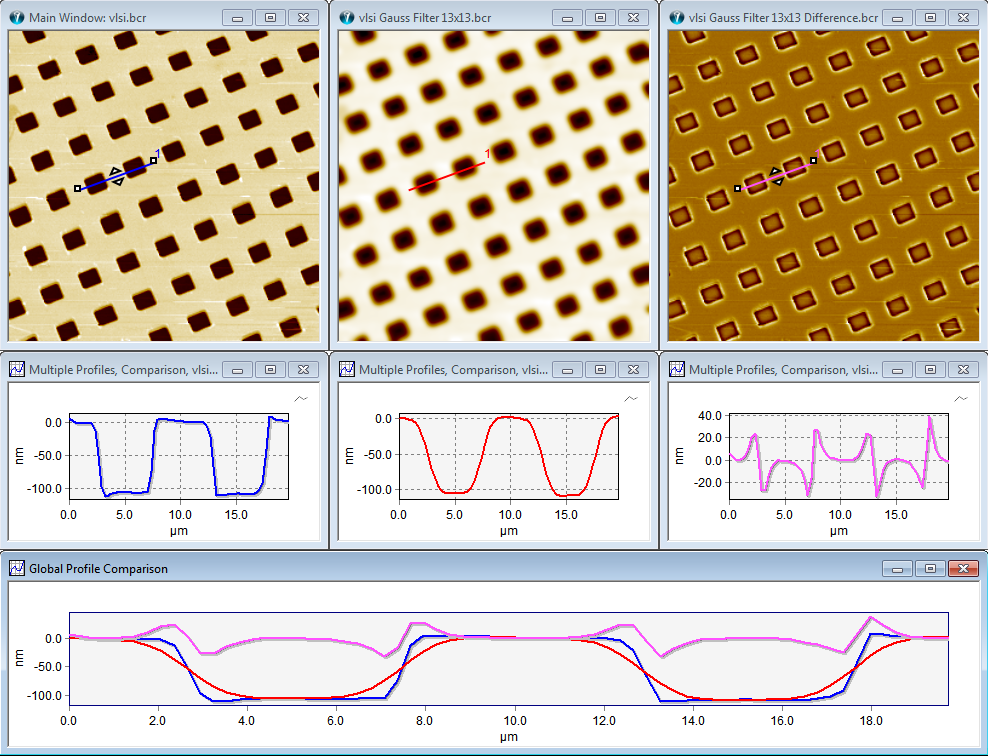
Clicking the Synchronize Profile in the right click menu or the Image Ribbon, will synchronize the selected profile with cross-section profiles at the same positions in all other image windows having the same number of pixels in the X and Y dimension. Thus, this is a good tool for detailed comparison of different image channels acquired from the same surface. This means that when moving a line in one window the others will follow to the same position and all cross sections will be shown together in the multi profile window. This is illustrated in the example below where a raw image is shown together with the results from smoothing and sharpening filters.
At the very bottom the curves are shown all together in the "Global Profile Comparison" window where the differences can be studied more detailed.
View Settings
From the View Settings pane it is possible to define the appearance of the profile window, such as colors, line width, axes ranges, etc.