Rp: Maximum profile peak height
Rv: Maximum profile valley depth
Ry: Peak-Peak
Rt,: Peak-Peak, ASME Definition
Rz,: Peak-Peak, ISO Definition
This is the difference between the maximum height and the minimum height of the profile

R10z:Ten Point Height
Rz_tph:Ten Point Height old legacy term
Ten Point Height is defined as the average height of the five highest local maximums plus the average height of the five lowest local minimums:


Where n is the number of points in the profile, and Ziis the height value at point i.

Where n is the number of points in the profile, and Ziis the height value at point i.
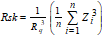
Where n is the number of points in the profile, and Zi is the height value at point i. If this parameter is zero it means that the height distribution is symmetric, for example Gaussian distributed. Peaks will cause Rsk to become positive and valleys will cause Rsk to become negative.
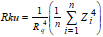
Where n is the number of points in the profile, and Zi is the height value at point i. The Kurtosis describes the sharpness of the height distribution, A Gaussian distribution has a Kurtosis close to 3. Wider distributions have a kurtosis less than 3 and narrower distributions a kurtosis greater than 3. High peaks or deep valleys will influence the kurtosis strongly.
This is the number of local maximums per length unit

where n is the number of profile points and δx the sampling distance
Rsc, is the average of the principal curvature of the local maximums on the profile, and is defined as:
 for all local mmaximums

Bearing Curve Based Parameters
Rbi: Surface Bearing Index
Rci: Core Fluid Retention Index
Rvi: Valley Fluid Retention Index
Rpk: Reduced Summit Height
Rk: Core Roughness Depth
Rvk: Reduced Valley Depth
Rdc-h: Height Intervals of Bearing Curve
RMR1: Upper Material Portion
RMR2:Lower Material Portion