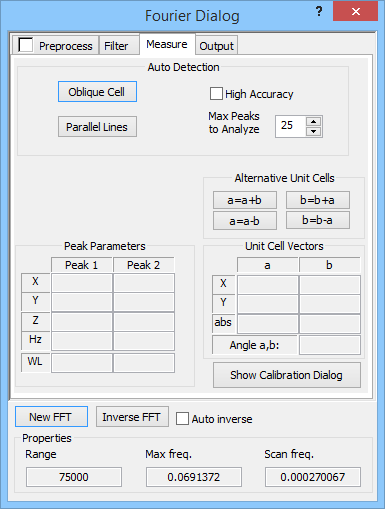
The Measure tab of the Fourier Dialog is used for measuring systematic periodicities in the image by analysis of the associated Fourier peaks at sub-pixel level. Periodicities are most often part of the true surface in which case we may want to use SPIP to detect and measure the lattice structure and maybe perform a calibration when the reference values are known. However, periodicities may also originate from coherent noise or vibration problems during the scanning process, in which case you can use SPIP to diagnose the problem and determine the time domain frequency in Hz.
SPIP can automatically detect oblique unit cells and parallel line structures based on the Fourier image.
Press the "Oblique Cell" or the "Parallel Lines" method to start the automatic detection. If the detection is successful the numeric fields describing the unit cell are updated and the unit cell is drawn in the spatial image.
For line structures the a vector parameters describes the repeat distance and orientation while the b vector is a perpendicular vector set to a size identical to the width of the image. This makes it possible to apply the oblique marker on line structures as well.
It is possible to change the number of max peaks for the algorithm, as such to make it more or less sensitive to the weaker peaks as only the most prominent peaks are analyzed.
For noisy images where SPIP may fail to detect the lattice structure, the detection algorithm may be assisted by removal of certain Fourier components, using the Fourier Filtering section, or by changing the scaling of the amplitude values (does not require an inverse Fourier transformation).
After a successful unit cell detection the "Unit Cell and Calibration Results" dialog will appear. Here, you can enter reference values and calculate the corresponding correction factors, see <Lateral Calibration and Unit Cell Detection> for further details.
For a noisy images where SPIP might fail to detect the unit cell correctly, the detection algorithm can be assisted by exclusion of Fourier components associated with noise, see Selective Fourier Filtering.
High Accuracy: When this checkbox is set on, the Fourier Peaks are found by a very accurate Sub-pixel Fourier algorithm otherwise the peaks are found by a faster but less accurate parabolic fit method. This setting is also used for semi-automated detections.
For further information about unit cells and unit cell detection consult the Reference Guide
By selecting two Fourier peaks associated with two corners of the reciprocal unit cell by the Peak Marker tool found in the Ribbon it is possible to determine the unit cell semi-automatically.
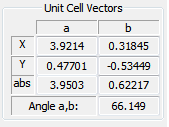
The associated spatial unit cell is calculated when the Peak 1 and Peak 2 pairs has been defined and the results are written in the Unit Cell Vectors box.
When a peak has been defined by the circle marker it's X, Y co-ordinates will be written as the Fourier pixel co-ordinates and the Z values are written as Fourier Image values using the same units as the main image. Note that the Z values will be influenced by, for example, the square root and the square functions.
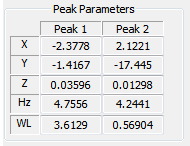
When the information on the scanning velocity is known the time frequency associated with the Fourier peak is calculated and shown in the Hz field. Use this feature as a diagnostic tool for characterizing noise and vibration problems. This frequency can often be found be close to the 50 or 60 Hz net frequency, a resonance frequency of the instrument or a sound frequency in the environment.
The spatial wavelength associated with the Fourier peak will be written in the WL fields. You may use this function to determine repeat distances of, for example, line structures.
The spatial unit cell is characterized by two unit cell vectors a and b for which the co-ordinates are written in the corresponding fields. The unit of the parameters will be identical to the lateral unit of the spatial image. Also, the absolute length of the unit cell vectors and their angle are written.
The result of the unit cell detection will also activate and update the Calibration and Unit Cell Results dialogue window where the correction factors are shown. Furthermore the unit cell results are written to *.cal files, which may be used by third party programs for statistical analysis. Note that the calibration results only have meaning when the reference data exists and are set correctly. Otherwise, the unit cell detection function is a powerful technique for accurate characterization of lattice structures.
The Unit Cell Results may also been seen in the Unit Cell and Calibration Results, which will popup automatically when a unit cell is found. Here you can also define how you want to have the unit cell displayed in the spatial image, see below.
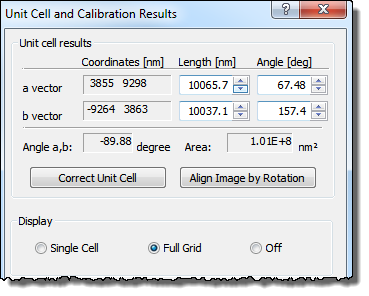
The spatial unit cell can be displayed as a "Single Cell" or as a "Full Grid". When the unit cell is displayed as a grid the grid represents the lattice structure associated with the unit cell. The spatial unit cell and the grid can be moved around with the mouse to visually inspect how well it fits to different parts of the image and as such to detect deviations from the lattice structure found. Deviations typically relates to non-linearity of the scanner.
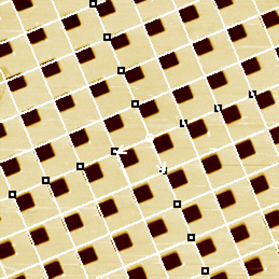
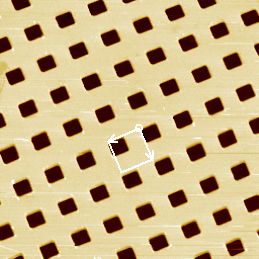
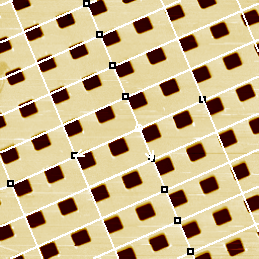
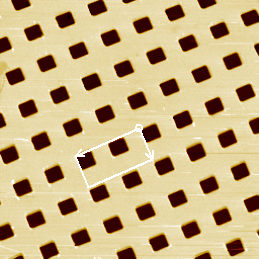
The figure shows different unit cell / lattice structures overlaid an image. In the first image is a full grid is shown as it was calculated from the Fourier peaks. The second image shows the same result but only as a single unit cell. In the last two images the cell has been modified manually by moving the handle points. This way you can define the unit cell size and angles freely.
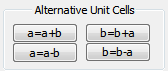
A lattice can be described by alternative unit cells, the one SPIP displays is one having the angle between the a and b vectors most close to 90 degrees. Sometimes it might be convenient to display the detected unit cell differently to highlight the correspondence with, for example, single molecules.
For this purpose SPIP provides four buttons a=a+b, a=a-b, b=b+a and b=b-a for interactive calculation of alternative unit cells by vector addition and subtraction.
The result is displayed simultaneously in the spatial image.