
Fourier analysis has powerful features for detailed characterization of image structures and manipulating images based on their Fourier spectrum. The Fourier tools can for example be used for:
Detection and characterization of line and lattice structures
Diagnosing time domain noise and vibration problems
Fourier filtering by inverse transformation.
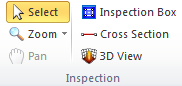
The functions of the Inspection Panel works very much the same way as for the 2D image inspection tools. The cross-section tool works different as one end of the line in anchored to the Origin of FFT image.
This Panel is very similar to the Color Scale Panel for normal 2D Images
It is possible to define the active color scale as default for Fourier windows, just by clicking the "Set as Default" button.
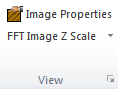
From the View Panel the Image Property Dialog can be invoked and the View Settings can be activated from the dialog launcher button at the lower right.
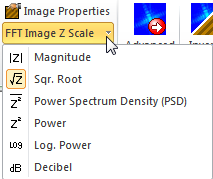
The Fourier image can be scaled in different ways:
The z values are calculated as:
 ,
,
where  is calculated as described in the Fourier Analysis section of the Reference Guide

This mode is the factory default mode and provides a contrast that is good for enhancing weak peaks.

Here, each Z value is calculated as the power value normalized with the area size of each element
 ,
,
where xRange and yRange is the physical range of the source image.


where an Offset value is subtracted so that min value equals zero:
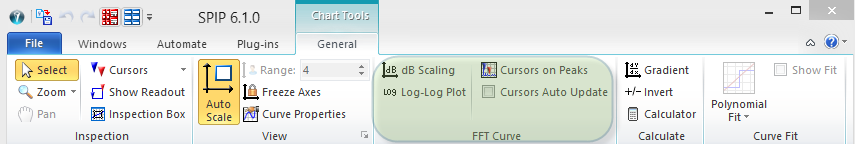
The Advanced FFT button will activate the Fourier Dialog from where more specialized analysis and filtering can be performed.
After having modified the Fourier image by for example defining AOI (or non-AOI) regions you can perform an inverse operation and see the results in the spatial image.
Set Auto On to get the spatial image updated by inverse FFT whenever the Fourier image is modified.
The Area of Interest (AOI) drawing tools are used for including or excluding certain areas from analysis and modification. The tools are described more detailed in Area of Interest Tools
A special feature of the FFT AOI tools is that all drawn AOI regions will be mirrored in the Fourier Origin point to obtain proper results when performing Inverse FFT, see example below:
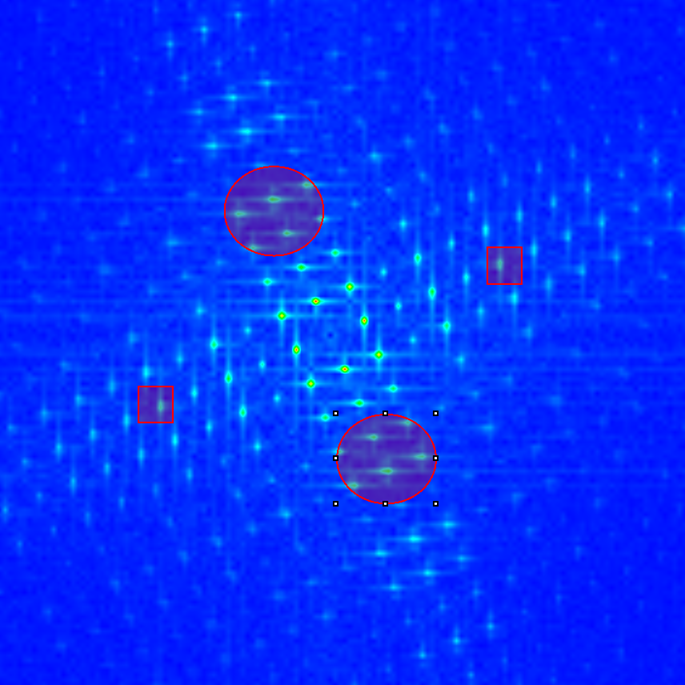
FFT AOI example where the regions come in mirrored pairs.
The AOI Ellipses tool has also an extra option for anchoring the center to the Origin of the Fourier image, which is practical for performing bandpass filtering rather than removing or enhancing certain periodicity.
The Circle Snap function is convenient when removing periodicity shown as peaks in the Fourier Image, because the circle/ellipsis will snap to the peak within the circle and move the circle so that its center will equal the peak point.

When clicking the Peak Marker tool SPIP will try to find two Fourier peaks which can be associated with a unit cell. These peaks will be found with sub pixel precision using a dedicated iterative algorithm. Initially the Unit cell grid will also be shown in the spatial image.
The Fourier Peak markers can now be moved to other peaks so that alternative unit cell can be calculated and displayed. When the peak markers are on the same line a 1 dimensional periodicity will be calculated using the most inner peak. See the example below:
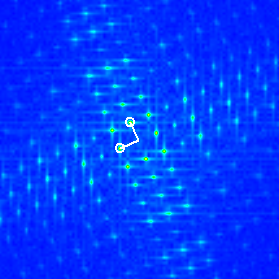
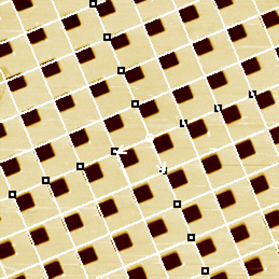
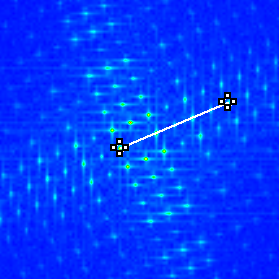
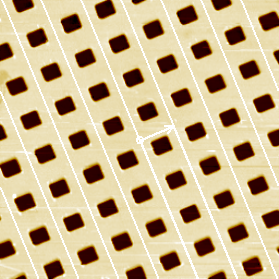
Unit Cell found by the Fourier Peak Marker tool. Upper left the peaks are initially set automatically and the corresponding lattice is displayed in the spatial image to the right. At the bottom the peaks are manually set to be on the same line and a line structure is calculated from the most inner peak and shown in the spatial image.
To see the numerical results for the found unit cell and calculate correction parameters, click the Dialog Launcher button:
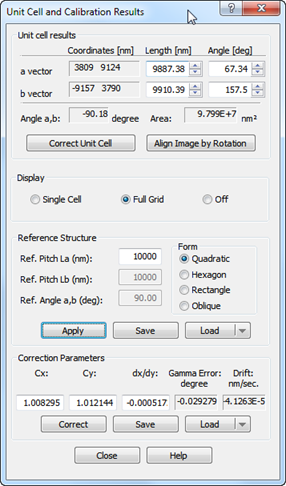
This dialog with its information and functions are described in the Lateral Calibration and Unit Cell Detection section.