
Charts not covered by the Profile Ribbons have their tools included in the Chart Tools contextual tab set. This is for example histograms, scatter plots and Fourier charts. Depending on which chart is active more of the tools will be disabled.
The Inspection Panel has the same functionality as described for profiles previously.

The View Panel is identical with the View Panel of the profile windows.
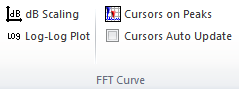
The FFT Curve Panel is dedicated to FFT curves only and described in more detailed in the 1D Fourier Analysis

Click this button to get the dy/dx gradient curve calculated and shown in its own window.
A polynomial fit from zero to 9th order can be activated by this "split button". When active the polynomial fit will be show together with the chart data.
IV spectroscopy curves do have their own "Derivatives" tabs for calculating various derivative curves:
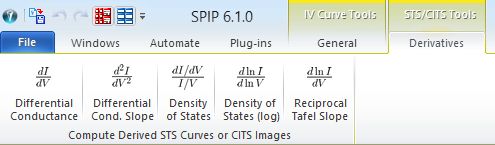
Descriptions of the derived curves are shown in the CITS section