The Continuous Imaging Tunneling Spectroscopy (CITS) module allows you to visualize and handle I/V spectroscopy data. The availability of this function depends on the file format used by the STM manufacturer. If your file format is not supported please contact us for an update.
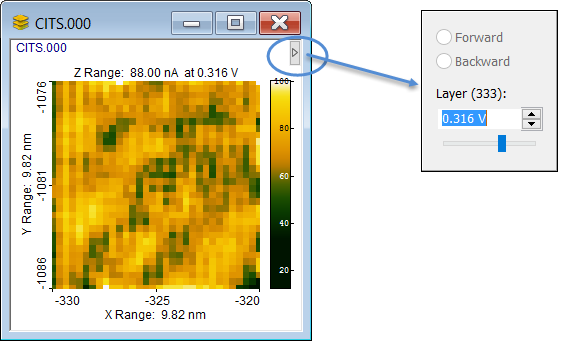
A volume image contains several layers and for the user it is possible to select the layer for which the signal should be shown, Typically the layer index will represent the voltage, while the shown image represents the current values for that voltage..
This can be done directly from the CITS image window by use of the "Layer Navigator"
To select which layer to see hoover with the mouse over the arrow key in the top right of the CITS window and a dialog will appear that facilitates layer selection:
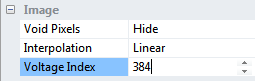
Alternatively the voltage layer can be selected from the View Settings Pane by the Voltage Index parameter found in the Image group:
Conveniently you may also combine the keyboard Shift key with the scroll wheel to select the Voltage value for which the current values should be shown.
CITS volume images has their own contextual tab set in the ribbon which will appear when a CITS image is activated
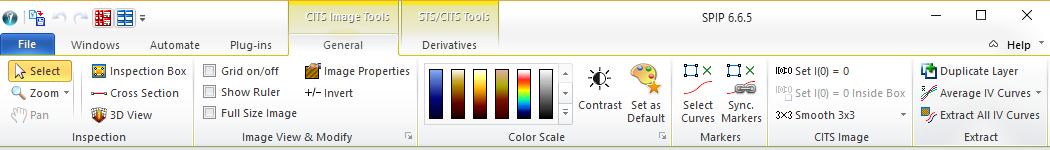
Most of the tools in the General tab are generic and shared with the General tab of 2D Images described previously. Therefore, we will here only describe the tool keys dedicated to CITS.
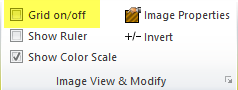
The CITS image window can be overlaid with a grid indicating the positions of the individual I/V acquisitions.

The Select Curves button located in the Markers panel is used for selecting one or more individual spectroscopy curves in the CITS image. Once selected, IV curves at other positions can be shown by dragging the IV selection marker. By drawing rectangles the IV curves acquired inside the boundary of the rectangle will be averaged and shown in the IV curve window.
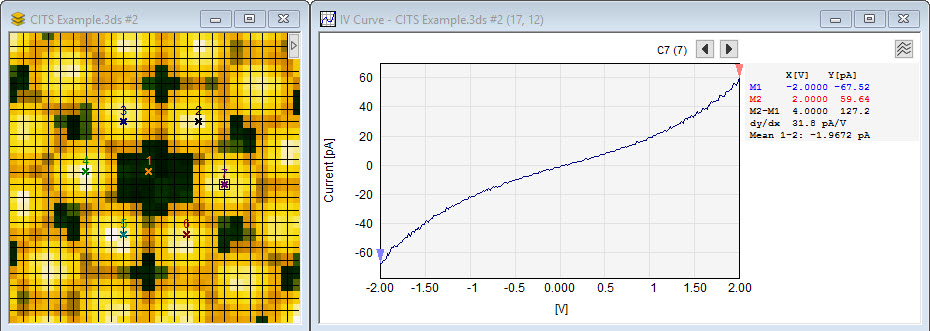
CITS Curve with multiple spectroscopy curve selections. The active spectroscopy curve is shown in the curve window in Analysis View, where cursors can be applied for further measurements. To show all selected curves the curve window can be switched to Comparison View mode.

When this button is enabled, the IV curve markers in the selected CITS volume image will also be displayed in any 2D images associated with the volume image. The markers can be moved and deleted in the 2D images, and the original markers in the force volume image will follow. In order to remove the markers from the 2D images, select the volume image again and toggle the Synchronize Markers button.
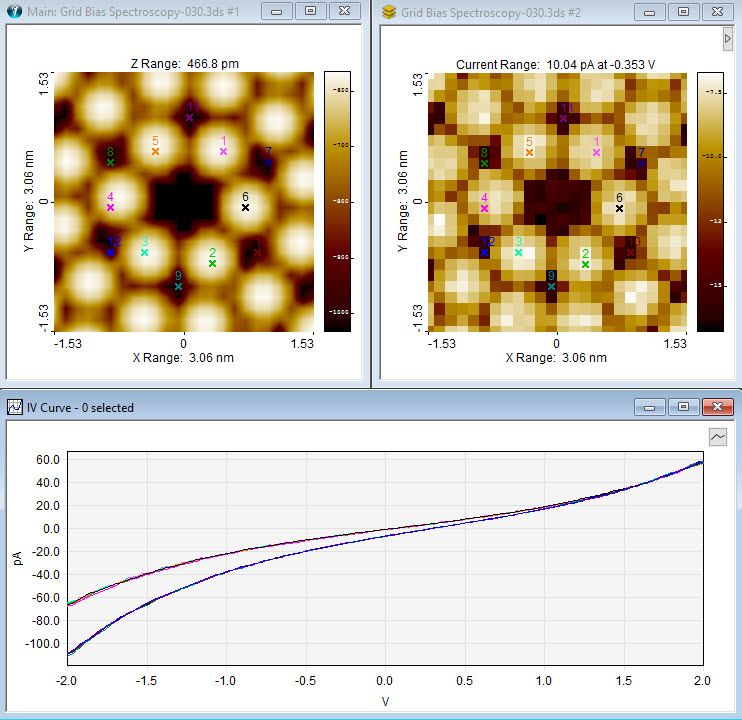
This example shows the synchronization of the CITS markers with markers in the associated topographic images. At the button all the extracted IV curves are shown.
Here, the spectroscopy curve is shown in Comparison View mode. To inspect and analyze individual curves one can switch the display to Analysis View, where cursors can be applied for further measurements.
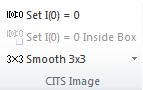
To correct the current values by an offset value such that the current will be zero for zero voltage press the Set I(0) = 0 or Set I(0) = 0 inside box.
To smooth the IV curves press Smooth 3x3 or Smooth 5x5, which will cause a calculation of average IV profiles for each x,y based on the 3x3 or 5x5 neighborhood.
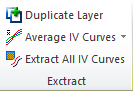
The Extract panel offers different ways of extracting data from the CITSVolume image without modifying the data.
Use this function to duplicate the shown layer to a new image window. You can select the height layer by use the Voltage Index parameter found in the Image group:
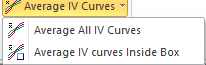
This function will calculate the average curve for all force curves included in the CITS image or just the ones selected by the inspection box
You can extract all curves into a single IV curve window for further analysis.
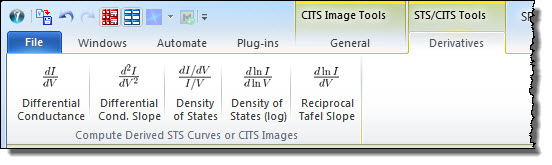
The Derivatives tab is shared with STS (Scanning Tunneling Spectroscopy) curves and offers more tools for calculating derivatives from I-V curves. For CITS images new volume images with the derived curves are calculated and for STS curves the derived curves are calculated and shown in new curve windows. The following derivatives can be calculated:
Differential ConductanceThe Differential Conductance is the local slope of the I-V curve. |

|
Differential Conductance SlopeThe Differential Conductance Slope is the second derivative (often called the in-elastic tunneling spectrum) of the IV curve and may reveal resonance peaks. |

|
Density of StatesThis is an estimation of the Density of States, |

|
Density of States (log)This is proportional to the Density of States using logarithm, |

|
Reciprocal Tafel SlopeThis is in electrochemistry is referred to as the inverse Tafel slope |

|
Below is seen an example of a STS data set read from a single file. In contrast to CITS images the IV curves are not recorded in a grid, but acquired at more random positions.
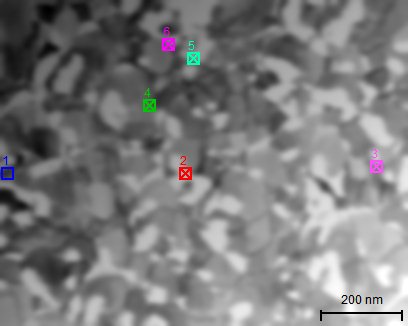
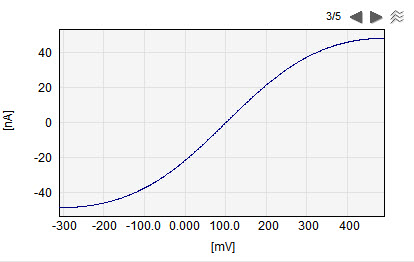
The STS image is a topographic image with a number of spots where STS curves has been acquired. These STS spots are marked when the image is opened and the individual STS curves can be checked On/Off and be shown in a STS Curve window as shown to the right. The STS Curve window can be viewed in the Analysis and Comparison view modes.