The MUFU method is not an ISO standard but a methodology developed by The Technical University of Denmark and Image Metrology

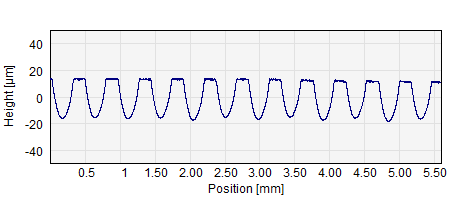
Example of a plateau-valley profile – which we call a MUFU profile
In the MUFU method the roughness profile is generated by applying a seeded robust Gaussian regression filter on the Primary Profile. The filter has the cut-off wavelength given in the Roughness Analysis pane. The filter line is subtracted from the Primary Profile in order to generate the Roughness profile and serves as reference line for the roughness calculations. The filter line is displayed in the Primary profile.
As the filter line becomes the reference line for the Roughness Profile it is extremely important to ensure that the Plateaus have been successfully placed around Z=0. If this is not the case it is necessary to change the filter settings.
There are two filters: A seeded 0th order robust Gaussian regression filter (RGR0) and a seeded 2nd order robust Gaussian regression filter (RGR2).
The Gaussian weighting function S(x) for the 0th order filter (RGR0) is a plain ISO 11562 Gaussian envelope, see Filters in Users Guide. The Gaussian weighting function S(x) for the 2nd order filter (RGR2) is slightly modified as described in the ISO 16610-31:2009 standard
The filter mean line w(x) is calculated by minimizing the equations below
0’th order regression minimization problem:

2nd order regression minimization problem:

The filter equations are solved iteratively


The threshold value CB is calculated using the upper quartile, Q3, of the residuals
Besides using the upper quartile for the threshold value CB the difference to the robust Gaussian regression method described in the ISO 16610-31 standard is that the first step of the iteration is substituted with a morphological closing filter as described in the ISO 16610-41:2006
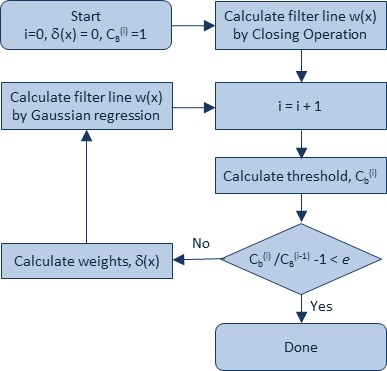
As shown in the figure below CBis calculated for every iteration. Thereafter the weights are calculated, and the Gaussian equation for that iteration is solved. This is repeated until the relative change in CB falls below e = 0.001.

Flow chart of the robust Gaussian regression filtering algorithm.
The closing filter used here is using a circular disc as the structuring element
A morphological closing filter is the result of applying a morphological dilation on the result of which morphological erosion is performed. The principle of dilation and erosion is shown in the figure below.

Dilation and erosion are performed by placing a disc in every point of the profile. The dilated curve (blue) consists of the maximum Z value of all circles for each point in the profile. The eroded (red) curve consists of all Z minima derived the same way. Closing is performed by applying erosion after dilation (orange curve to the right). Closing suppresses valleys when the disc radius is sufficiently large.

Result of applying a morphological closing operation with a disc radius of 0.8 mm on a MUFU plateau/valley profile. It is obvious that choosing a disc with a lager radius, i.e. increasing the Closing Cut-Off Ratio would give abetter valley suppression.
Plateaus are separated from valleys by the following procedure
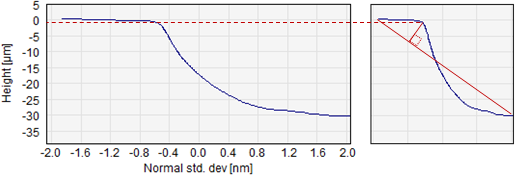
A height threshold level is calculated by finding the “knee” in the Material Probability Curve. First the Material Probability (MP) Curve is normalized so that the X and Y range becomes square. Then a line is drawn from the left most point to the right most point. The ordinate value in the un-normalized curve corresponding to the point in the normalized curve which has the largest outward distance from this line is the plateau valley threshold level – in the following denoted the upper threshold.

Material Probability Curve, original (left) and normalized (right) with indication on how to find the upper threshold level.
Segmenting the profile at this height level may, however, result in over segmentation because there may be local dips or valleys inside plateaus. Therefore, the profile is first thresholded at a lower level where after the sides of the resulting “plateaus” are removed up to the upper threshold level. The lower threshold is chosen as

where Rv and Rz are calculated on the MUFU Roughness Curve according to the ISO 4287 standard.

In order to avoid splitting plateaus at small local valleys the profile is first thresholded at a lower level where after further points are removed until the upper threshold is reached, thereby defining the intersection between neighboring plateaus and valleys.
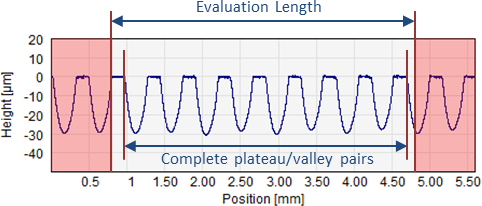
All MUFU parameters and curves are evaluated for the number of consecutive complete peak/valley pairs within the Evaluation Length. Thus the total distance spanned by the plateau/valley pairs will almost always be shorter than the Evaluation Length.

For all parameter calculations only complete plateau / valley pairs are included
In addition to the graphs available for all standards the MUFU method also offers to display the separated plateaus and the separated valleys independently. These are mostly provided for instructive purposes but also makes it clear exactly which part of the profile has been used for the MUFU parameter calculations and which parts are valleys and which parts are plateaus.

Separate plateau/valley graphs. Note that the height scale is different on the two shown graphs.