You are here: Reference Guide > Roughness and Texture Parameters > General roughness charts
General roughness charts
Height / amplitude distribution
This chart is a histogram showing the distribution of heights in the profile or image. The ordinate is given in % but is really arbitrary as the numbers will scale inversely with the histogram bin width. The histogram has 500 bins unless there are two few data points in the profile or image to justify that many bins. The bin width is given by the height range divided by the number of bins. The roughness analysis height distribution charts allow simple cursor readout of data values. For advanced height distribution analysis, such as material/void analysis the “Histogram” on the Analysis ribbon tab should be used.

The roughness height distribution charts, left: horizontal, right: vertical.
Material Ratio curve / Abbott curve
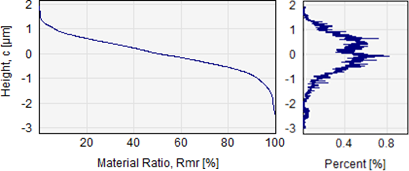
The Material Ratio Curve displays the relative amount of surface (abscissa) above a given height level (ordinate) for an image or a profile, see for example the description of the ISO 4287 standard parameters. In reality this curve is the integration of the height distribution for the profile or image data. The Material Ratio Curve is also known as the Abbott-Firestone curve.

Material Ratio Curve (left) with the vertical height distribution shown to the right
Material Probability Curve
The Material Probability Curve (see definition in the ISO 13565-3 standard [44]) is a representation of the Material Ratio Curve where instead of plotting the accumulated probability of height values in a linear 0-100% scale on the abscissa the heights are plotted in units of standard deviations of a normal (Gaussian) distribution with the same mean and standard deviation as the height data. A normal distribution will produce a straight line in this type of plot. Therefore this chart is useful for studying how close the distribution of heights of a given surface is to a normal distribution.

Material Ratio Curve (left) and Material Probability Curve (right)


