The scope of this framework of ISO standards is to provide methods for general evaluation of surface texture using stylus profilometers which typically record profiles with lengths of several millimeters. The mathematics of course also works for profiles recorded by other tools and for shorter or longer profiles. When using the ISO 4287 standard in a “nonstandard” way it is very important in any reporting to specify exactly how the analysis was set-up.
The ISO 4287 written standard is part of a frame work of Geometrical Product Specifications (GPS) standards comprising:
SPIP™ helps the user to evaluate roughness of profiles according to this framework of standards, by providing relevant default choices for filter cut-offs and by providing warnings and information in the bottom of the Roughness Analysis pane. However, it is strongly recommended to study the original written standards.
The ISO 4287 written standard is available (for purchase) from ISO (www.iso.org) and from various national standardization bodies. The standard has also been elaborated in various text books
The Primary Profile is generated from the raw profile as described in the general section for profile roughness steps. In order to comply with the ISO standard framework it is mandatory to subtract the nominal form of the raw profile and to suppress short wave lengths using a λs filter according to the nominal values given in the ISO 3274 standard, see table below.
The Roughness Profile is generated by applying a high pass Gaussian filter according to the ISO 11562:1996 standard, see Filters in Users Guide, and the new ISO 16610-21 standard.
This filter suppresses long wave lengths using the λc cut-off wavelength specified in the user interface. Hence, the Roughness Profile contains the shorter roughness components of the profile. In order to reduce distortions from the filtering process at the ends of the profile, end effect correction using the moment retainment criterion of 1st order as described in the ISO 16610-28:2008 standard is applied. This means that in the majority of cases it is not necessary to exclude the end regions of the profile from the parameter calculations. (Note, that the end-effect correction applied when using the ISO 11562 filter in the Filter Dialog or from Quick Launch follows the “Border Mode” for the used filter setting, which differs from this method).
According to the ISO 3274:1996 written standard the nominal values for λs and λc should follow the series
... mm; 0.08 mm; 0.25 mm; 0.8 mm; 2.5 mm; 8.0 mm; … mm
The inter relationship between the two cut-off values, the stylus (or tip) radius and the point spacing is also given in the ISO 3274 standard and is reproduced in the following table. Guidelines to choice of evaluation length and λc cut-off (same as sampling length) is provided in the ISO 4288 standard. If it is necessary to deviate from the standards, this should always be properly specified.
|
λs (mm) |
λc (mm) |
λc / λc (mm) |
Max. probe radius (µm) |
Max. point spacing (µm) |
|
0.08 |
2.5 | 30 | 2 | 0.5 |
| 0.25 | 2.5 | 100 | 2 | 0.5 |
| 0.8 | 2.5 | 300 | 2 | 0.5 |
| 2.5 | 8.0 | 300 | 5 | 1.5 |
| 8.0 | 25 | 300 | 10 | 5.0 |
Nominal values for λs and λc given in the ISO 3274:1996 written standard.
The Waviness Profile is simply the difference between the Primary Profile and the Roughness Profile, though according to the ISO 4287 standard the Waviness Profile is the Primary Profile filtered using a cut-off wavelength λf in order to suppress long wave components followed by suppressing short wave components using the λc cut-off wavelength. λf filtering is, however, rarely used in practice [36] and is also not well specified in the ISO standards. Therefore this option has been omitted in SPIP™.
The Sampling Length is defined in the ISO 4287 standard as “the length in the X direction used for identifying the irregularities characterizing the profile under evaluation”. Put in other words, it is the distance required for being able to include enough small irregularities for a relevant evaluation while not including non-relevant long wavelength components. In fact, according to the ISO 4287 standard, different Sampling Lengths apply to the Primary Profile, the Waviness Profile and the Roughness Profile. Most parameters are calculated for one Sampling Length at a time and thereafter averaged over the number of Sampling Lengths (number of cut-offs).
A procedure for choosing the Sampling Length (among the standard values) for the Roughness Profile is given in the ISO 4288 standard. This Sampling Length is numerically identical to the λc cut-off wavelength. As there is not applied a λf filter for in SPIP™ for generating the Waviness Profile there is no logical choice for the Sampling Length. Therefore the Waviness Profile Sampling Length is the same as for the Roughness Profile, namely λc, which is common industrial practice

The Sampling Lengths for the Roughness and the Waviness Profiles are both equal to the λc cut-off wavelength. The Evaluation Length is the sum of the Roughness Profile Sampling Lengths. The Primary Profile Sampling Length is equal to the Evaluation Length.
Instead of evaluating just one Sampling Length per profile a number of consecutive Sampling Lengths are usually evaluated. The default number is 5, according to the ISO 4288 standard. The total distance spanned by the consecutive Roughness Profile Sampling Lengths is called the Evaluation Length of the profile. The Evaluation Length is always centered on the profile and the actual length is hence equal to N times the λc cut-off wavelength, where N is the “Number of Cut-Offs” in the user interface. The ends of the profile not part of the Evaluation Length are indicated by color shading.
The roughness parameters can be calculated from the primary, the roughness and the waviness profile and to distinguish the parameters the names are preceded by a letter identifying the source profile:
R parameters are calculated on the Roughness Profile
W parameters are calculated on the Waviness Profile
P parameters are calculated on the Primary Profile
| Maximum profile peak height: Rp, Wp,Pp |
| The maximum height value within a Sampling Length |
| Maximum profile valley depth: Rv, Wv, Pv |
| The minimum height value within a Sampling Length |
| Total height of the profile: Rt, Wt, Pt |
| The difference between the maximum height value and the minimum height value within the Evaluation Length |
| Maximum height of the profile: Rz, Wz, Pz |
| This is the difference between the maximum height and the minimum height within a sampling Length |
| Arithmetic mean deviation of the profile: Ra, Wa, Pa |
|

Where n is the number of points within a sampling length, and Zi,is the height value at point i. |
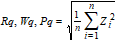
| Root mean square deviation of the profile: Rq, Wq, Pq |
|
Where n is the number of points within a sampling length, and Zi,is the height value at point i. |
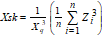
| Skewness of the profile height distribution: Rsk, Wsk, Psk |
|
Where n is the number of points within a sampling length, and Zi is the height value at point i. If this parameter is zero it means that the height distribution is symmetric, for example Gaussian distributed. Peaks will cause Xsk to become positive and valleys will cause Xsk to become negative. |
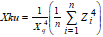
| Kurtosis of the profile height distribution: Rku, Wku, Pku |
|
Where n is the number of points within a sampling length, and Zi is the height value at point i. The Kurtosis describes the sharpness of the height distribution, A Gaussian distribution has a Kurtosis close to 3. Wider distributions have a kurtosis less than 3 and narrower distributions a kurtosis greater than 3. High peaks or deep valleys will influence the kurtosis strongly. |
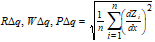
| Root mean square slope of the profile: RΔq, WΔq, PΔq |
|
Where n is the number of points within a sampling length, and Zi is the height value at point i and Δx is the point spacing in the X direction. |
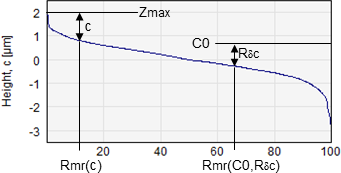
| Material ratio of the profile: Rmr(c), Wmr(c), Pmr(c) |
|
Percentage of the profile with height values greater than (Zmax – c) calculated over the entire Evaluation Length. Zmax is the maximum height value within the Evaluation Length. In practice this is a read out of the abscissa value for a given ordinate, (Zmax – c), on the Material Ratio Curve (Abbott-Firestone curve).
Material Ratio Curve. The relative amount of material above a certain height level in percent.
|
| Relative material ratio of the profile: Rmr(C0, Rdc), Wmr(C0, Wdc),Pmr(C0, Wdc) |
|
Percentage of the profile with height values greater than (C0– Rδc) calculated over the entire Evaluation Length. In practice this is a read out of the abscissa value for a given ordinate, (C0– Rδc), on the Material Ratio Curve (Abbott-Firestone curve). |
|
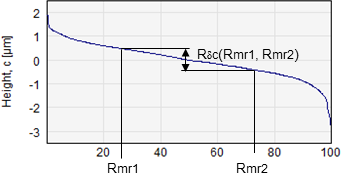
Profile section height difference: Rδc(Rmr1,Rmr2), Wδc(Rmr1,Rmr2), Pδc(Rmr1,Rmr2) |
|
Height difference between the two points on the Material Ratio Curve with abscissa values (material ratio percentages) Xmr1 and Xmr2, Xmr1 < Xmr2 where X = R, W or P.
|
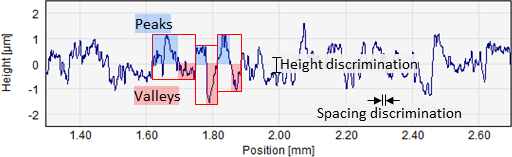
| Mean width of profile elements: RSm, WSm, PSm |
|
Mean width of profile elements within the Evaluation Length
Profile elements are neighboring peak-valley pairs.
National metrology laboratories such as NPL
Profile Elements consist of neighboring Peak and Valleys fulfilling the height and spacing criteria. Each profile element is described by its height and its width. |
| Mean height of profile elements: Rc, Wc, Pc |
| Mean height of profile elements within the Evaluation Length. See comments for RSm. |
| Peak count number: Rpc, Wpc, Ppc |
|
Number of profile elements per unit length of the profile: 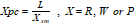
Where L is equal to 10 millimeters. This parameter is described in Amendment 1 to the ISO 4287:1997 standard (ISO 4287:1997/Amd. 1:2009). The implementation in SPIP™ is slightly different compared to the standard, where a height criterion of ±0.5 µm is recommended. In SPIP™ the same height criterion as for (R,P,W)sm is used. |