You are here: Reference Guide > Roughness and Texture Parameters > The ISO 13565-2 Standard
The ISO 13565-2:1996 Written Standard
The scope of this standard [43] and its associated ISO standards is to provide a method for analyzing the surface texture of stratified surfaces, for example plateau honed surfaces of engine cylinder liners. These surfaces are characterized by a plateau with a small micro roughness plus a distribution of deeper scratches. The standard is intended for analyzing profiles recorded using stylus profilometers which typically record profiles with lengths of several millimeters. The mathematics also works for profiles recorded by other tools and for shorter or longer profiles. When using the ISO 13565-2 standard in a “nonstandard” way it is very important in any reporting to specify exactly how the analysis was set-up. The related Geometrical Product Specification (GPS) standards comprise:
- ISO 13565-1:1997 [42] Surface texture: Profile method; Surfaces having stratified functional properties – Part 1: Filtering and general measurement conditions
- ISO 13565-2:1997 [43] Surface texture: Profile method; Surfaces having stratified functional properties – Part 2: Height characterization using the linear material ratio curve
- ISO 3274:1996 [41] Surface Texture: Profile method – Nominal characteristics of contact (stylus) instruments
- ISO 11562:1996 [45]] Surface texture: Profile method – Metrological characteristics of phase correct filters / ISO 16610-21:2008 Filtration: Linear profile filters - Gaussian filters
The ISO 13565-1 [42] and ISO 11562 [45]] provide the details of the filtering procedure and the ISO 3274 [41] standards describe the measurement conditions and the generation of the Primary Profile from measured data.
The Roughness Profile, Cut-Off and Evaluation Length
Unlike the ISO 4287 standard it is only the roughness profile which is evaluated. The roughness profile is generated by high pass filtering the Primary Profile using the Cut-Off Wavelength, λc, specified in the Roughness Analysis pane. According to the ISO 13565-1 standard there are only two choices for, λc, with corresponding Evaluations Lengths 5 times the cut-off wavelength. The λc = 0.8 mm is the default choice. The Evaluation Length is always 5 times the cut-off.
| λc |
Evaluation Length |
| 0.8 mm |
4 mm |
| 2.5 mm |
12.5 mm |
Because of the plateau / deep valley nature of these surfaces the Gaussian filter used for the ISO 4287 standard will produce a filter mean line which is distorted by the deep valleys. Therefore a semi robust filtering of the profile, according to the ISO 13565-1 standard is performed.
First a Gaussian filter (same as described for ISO 4287) with the chosen cut-off is applied on the Primary Profile in order to generate a filter mean line (the long wave component of the Primary Profile). Thereafter all points below the generated filter mean line are replaced by the filter mean line in a temporary copy of the Primary Profile. This profile is then filtered again using the same Gaussian filter. The resulting short wave component (the new filter mean line subtracted from the Primary Profile) is the Roughness Profile .
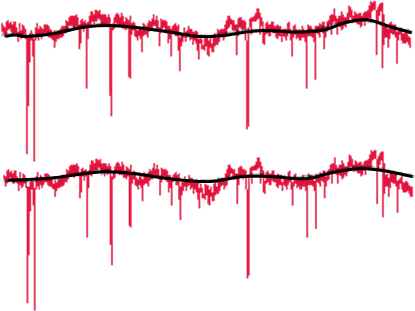
The two filtering steps: The upper graph shows the filter mean line (black) after applying a standard Gaussian filter (as for the ISO 4287 standard). The lower graph shows the filter mean line after the second pass where the influence of deep valleys has been suppressed.
Parameters
All parameters of this standard are derived from the Material Ratio Curve calculated within the Evaluation Length of the profile.
The procedure in short is: First, a straight line is fitted to a range of 40% along the abscissa corresponding to 40% of the points in the Roughness Profile. The range should be selected so that the line has the smallest possible slope. Then this line is extended to 0% and 100% two horizontal intersection lines are drawn where the fitted line intersects 0% and 100%.
The upper line separates protruding peaks from the Core Roughness Profile and the lower line separates deep valleys from the Core Roughness Profile. The area between the upper intersection line and the Material Ratio Curve is the peak area A1. The area between the Material Ratio Curve and the lower intersection line is the valley area A2.
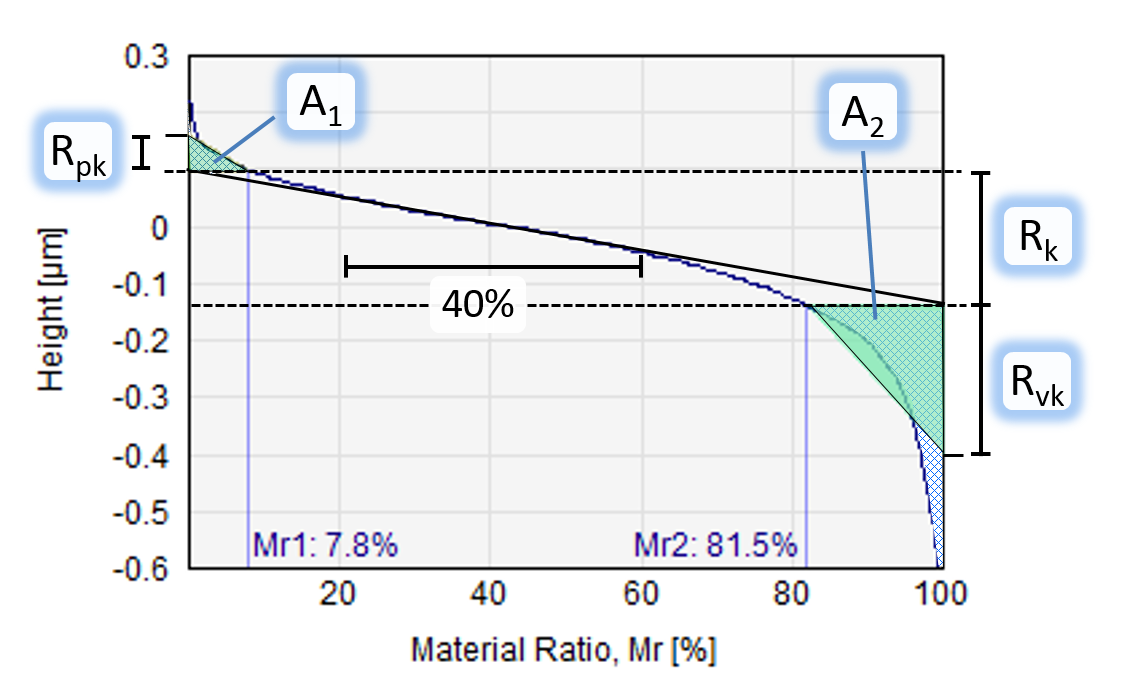
Figure 2: Bearing curve illustrating the calculation of Reduced Peak Height, Reduced Valley Depth and Core Roughness Depth
| Mr1
|
| Material ratio where the upper horizontal intersection line which separates protruding peaks from the core roughness profile crosses the Material Ratio Curve. |
| Mr2
|
| Material ratio where the lower horizontal intersection line which separates deep valleys from the core roughness profile crosses the Material Ratio Curve. |
| Rk : Core roughness depth
|
| The core roughness depth is the height difference between those two points where the horizontal
intersection lines cross the Material Ratio Curve.
|
| Rpk : Reduced peak height
|
| Average (with outlier suppression) height of the protruding peaks above the core roughness profile. Rpk calculated as the height of the right angle triangle, which has the same area as the peak area A1 and Mr1 as its base. |
| Rvk : Reduced valley depths
|
| Average (with outlier suppression) height of the deep valleys below the core roughness profile. Rpk is the height of the right angle triangle, which has the same area as the valley area A2 and 100%-Mr2 as its base. |