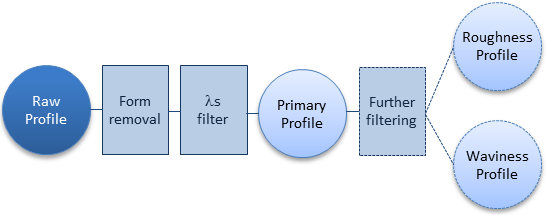
Roughness analysis of profiles involves typically more steps with the aim of noise removal and separation of the input curve into other curves from which the roughness parameters and charts can be extracted.
The Primary Profile is generated from the raw curve by subtracting a least means square fitted line or parabola in order to remove nominal tilt or form and thereafter applying a low pass Gaussian filter in order to suppress very short wave components such as noise. Optionally these steps can be disabled or form removal can be reduced to just subtracting the mean height, in case the user has performed these steps prior to the analysis.
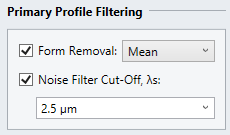
The Form removal and noise filtering is controlled in the Primary Profile Filtering section in the Roughness Pane:
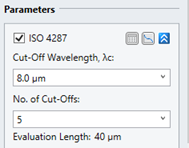
If present the Roughness Profile, is generated by further filtering of the Primary Profile where the short waves are preserved and the long waves suppressed. Which waves to suppress is determined by the cut-off wavelength λc which depending on the selected standard is available in the Parameters section of the Roughness Pane, below it is shown for the ISO 4287 standard:
If present the Waviness Profile, is also generated by filtering of the Primary Profile where the long waves are preserved and the sort waves suppressed. It is using the same cut-off wave length as for generating the Roughness Profile and therefore equals the difference between the Primary Profile and the Roughness Profile.
When performing a roughness analysis a number of windows with optional evaluation profiles and charts may be generated. Three types of windows are generated:
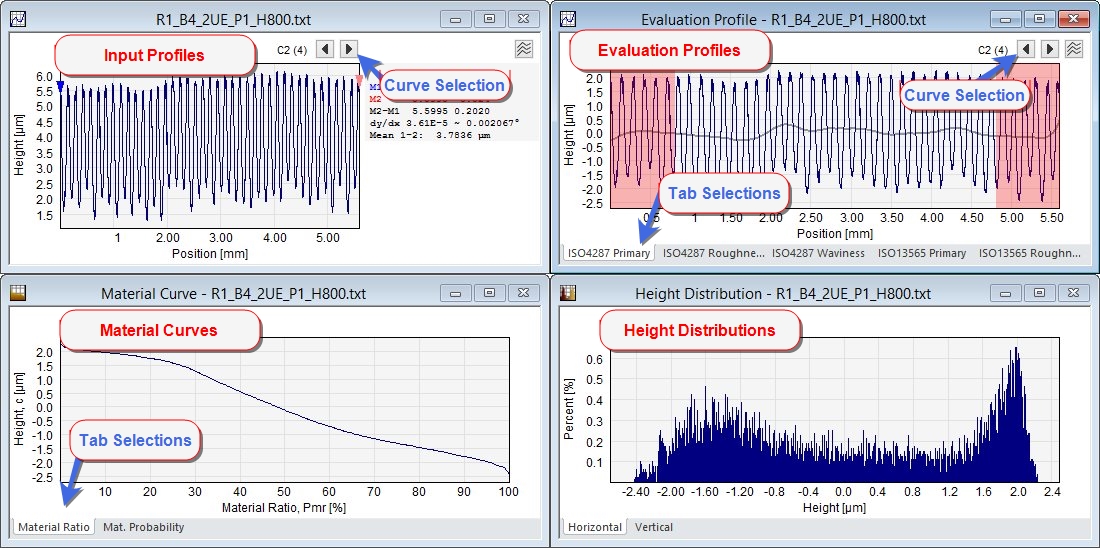
The windows are connected such that the Material and Height Distribution graphs will be updated when selecting a new tab in the Evaluation Profile Window. Likewise all windows will be updated when choosing another curve from a curve selection in the input window or in the derived profile window. Additionally the height axis on all charts will be synchronized with the height axis on the shown evaluation profile.
The Derived Profile window may contain various filtered versions of the input profiles determined by the chosen standards and the filter settings. Below is seen a set of profiles generated for the ISO 4287 standard.
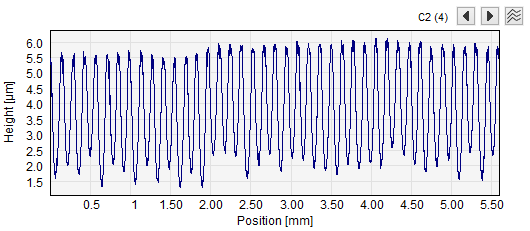
An Input profile window containing a set of four profiles. "C2 (4)" indicates that profile number two out of four is selected
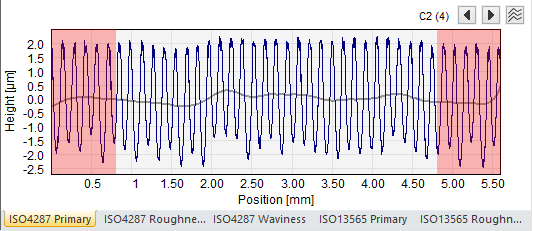
The Evaluation Profile window with various filtered versions of the input profiles. Here the ISO4287 primary profile is shown with the evaluation length between the red borders. The calculated waviness profile is overlaid.
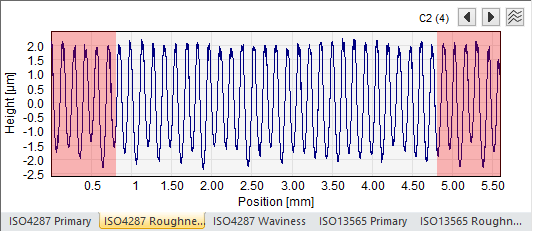
Here the corresponding ISO4287 Roughness profile is shown.
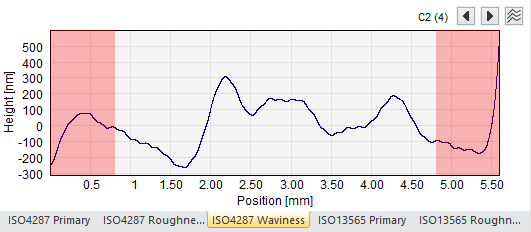
Here the corresponding ISO4287 Waviness profile is shown on a smaller y-scale
To learn about the Roughness parameters that can be calculated for profiles please see the Reference guide for the respective standards and methods: ISO 4287, ISO 13565, MUFU