You are here: User's Guide > Roughness and Texture Analysis > Roughness Analysis
Roughness Analysis Procedure
Roughness in its traditional sense can be calculated for topographic images or profiles where the data represents height values. To avoid misinterpretations roughness analysis is disabled for data windows not containing topographic data, such as optical micrographs or scanning electron microscope (SEM) images.
Roughness Calculation Steps:
- Roughness is calculated by connecting the currently selected image window or a profile window to the Roughness Analysis pane. This is done either by clicking the Roughness Analysis button in the Analysis tab in the Ribbon, or by clicking the Set button in the Roughness Analysis pane, see screen image below . When SPIP™ is started the first time the Roughness Analysis pane is not present, but will show up when the Roughness Analysis button in the Ribbon is clicked. image window or a profile window to the Roughness Analysis pane.
- With a connected window to the Roughness Analysis pane the appropriate standards or parameter collections should be selected, and any preprocessing may be adjusted.
- For each standard or parameter collection, the desired parameters and charts are selected by clicking the Parameters and Charts buttons, respectively, which gives access to the Parameters and Charts selection dialog. Last the filter settings, if any, are adjusted for each standard. The filter settings are revealed by clicking the blue button with the two arrows.
- You are now ready to perform the calculation by clicking the Calculate button.
- To generate a report you click the Report button and select the Microsoft Word format or the HTML format
When calculations are completed the Roughness Results pane pops up (if not already present) with the calculated parameters. Any selected charts, and in the case of profile analysis also the filtered profiles, show up in the workspace area next to the source window.
In the case of profiles, the Input Window can contain a collection of profiles and all profiles in the collection will then be evaluated. The preprocessed and filtered profiles (for example the Roughness Profiles and the Waviness Profiles for the ISO 4287:1197 written standard) are shown as tabs in the same window - the Evaluation Profile window
Note: Any change to the Roughness Analysis setup, Input Window, choice of parameters, charts etc. requires a new calculation.
Example of profile roughness analysis in SPIP™

The Roughness Results pane always shows the calculated parameters (if any) for the selected input window. However, the Roughness Analysis pane itself is static and only changes its Input Window when the Set button is pushed, or when one of the Roughness Analysis buttons in the Ribbon is pushed. This has the advantage that it is always well defined which image or profile the pane operates on.
Further the choice of parameter and processing options do not change when switching the Input Window, except of course when switching from an image to a profile or vice verse. This makes it easy to apply the same setup for multiple Input Windows, but has the disadvantage that it is a bit cumbersome to apply different setups on different Input Windows, especially when jumping forth and back between Input Windows.
The Roughness Analysis Pane
The pane will appear differently depending on whether the source window is an image window or a profiles window. Below is to the left seen how the pane may appear with an image selected as source and to the right with a number of profiles selected.
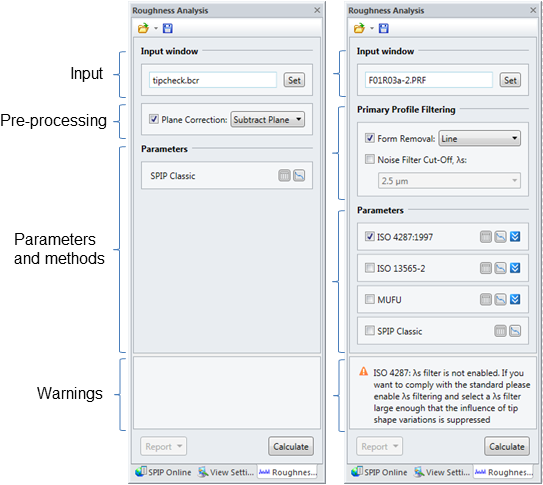
Input Window
This field shows the names of the image or profile(s) currently connected to the Roughness Analysis pane. To define the data to be analyzed one should click on the desired data window and then click the "Set" button in the Input Window section.
The field has a maximum height of two lines, so in the case a large number of profiles are present in the Input Window only the names of the first few are displayed. However, by hovering the mouse pointer over the field, a tool tip will show the names of all profiles in the Input Window.
Pre-processing section
This section contains pre-processing options. For images only very simple Plane Correction is offered limited to either subtracting a mean plane or the mean height from the image data before parameter calculations. Mean Plane subtraction is the recommended default and complies with other software packages such as for example the Bruker NanoScope software. The "Subtract Mean” option is present as a backwards compatibility option for users migrating from SPIP™ versions prior to SPIP™ 4.6.0 where the mean height was always subtracted. In case the user has made an effort filtering the image, Plane Correction may be disabled.
For profiles pre-processing comprises Form Removal, and Noise Filtering. Form Removal offers subtraction of the mean height or a mean line from the raw profile or the subtraction of a fitted parabola. Noise filtering is an ISO 11562:1996 / ISO 16610-21 Gaussian short wavelength "λs” rejection filter, which removes wave lengths shorter than the λs cut-off. λs filtering is required in order to comply with the ISO standards (se later). The pre-processed raw profile is called the Primary Profile in agreement with the ISO standards. This is why this section is called Primary Profile Filtering for profiles. The Primary Profile is shown together with the filtered profiles in tabs in the same profile windowFor profiles pre-processing comprises Form Removal, and Noise Filtering. Form Removal offers subtraction of the mean height or a mean line from the raw profile or the subtraction of a fitted parabola. Noise filtering is an ISO 11562:1996 / ISO 16610-21 Gaussian short wavelength "λs” rejection filter, which removes wave lengths shorter than the λs cut-off. λs filtering is required in order to comply with the ISO standards (se later). The pre-processed raw profile is called the Primary Profile in agreement with the ISO standards. This is why this section is called Primary Profile Filtering for profiles. The Primary Profile is shown together with the filtered profiles in tabs in the same profile window
Parameters section
In the Parameters section one can choose different written standards and methods to adhere to. Please see the Reference Guide for details. For images there is only one method "SPIP Classic” available. This is an all-round collection of image roughness parameters ranging from simple roughness average to advanced texture parameters. This parameter collection contains the "Birmingham fourteen” parameters [6] and overlaps with written standards such as ISO 25178-2 and ASME-B46.1 (see Reference Guide) and contains the same parameter set available in SPIP™ versions prior to SPIP™ 6.1.0. Likewise "SPIP Classic” for profiles is identical to the collection of profile parameters available in SPIP™ versions prior to SPIP™ 6.1.0 and is a sub-set of the corresponding image parameters.
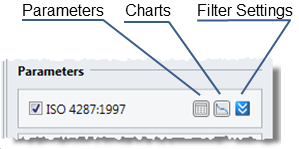
The parameters to be reported is selected in the Parameters Selection dialog which is started by pressing the "Parameters” button for the chosen standard. For a description of roughness parameters, please see the Reference Guide.
Likewise the Charts to be generated are selected by clicking the Charts button. Charts and Parameters are actually selected in the same dialog, but appear on different tabs. There is also a tab for the selection of desired statistics to be reported for Batch processing and for analysis of profile collections.
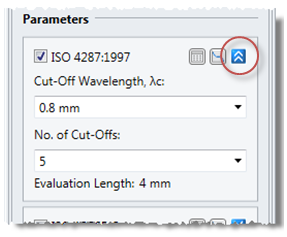
Filtering Options
Some standards require setting up filtering options. These options are made visible by clicking the blue "Filter Settings” button. They can be hidden again by clicking that same button. Toolmaking provide help for setting up filtering correctly, and the input fields pull downs suggest standardized values. Please see the specific written standards or the Reference Guide for precise information
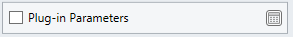
Plug-in Parameters Section
If roughness plug-ins are available there will appear a parameter section where the defined plug-in parameters can be selected, such that they are calculated simultaneously with the other roughness parameters.
Warning section
In the Warning section the user is informed whenever filtering settings or pre-processing settings are incompatible or not according to the chosen written standards. There are three information levels:
 Information: Information: |
Friendly information to the user. No real problems with the Roughness Analysis setup
|
 Warning: Warning: |
Calculation makes sense, but the user has chosen settings which do strictly adhere to the chosen written standards, or there are circumstances which make the Roughness Analysis dubious. |
 Error Error |
The Roughness Analysis setup makes calculation impossible for the current image or profile(s), for example if profile filter cut-offs are shorter than the point spacing or if they are longer than the length of a profile. In case of "Error” the Calculate button is disabled prohibiting calculation. |
Reporting
The "Report” button is a short cut to generating either a Word or a HTML report of the analyzed data. A fixed selection of Built-in Active Report templates will be used depending on whether the Input Window is an image, a single profile or a collection of profiles. The report button is really just a short-cut to the Report Quick Launch button on the Automate ribbon tab, where other Active Report templates are available, and where the user's own report templates, if any, are listed. License to the Batch Processing module is required for generating reports.
The parameters and charts selection dialog
The "Parameters” dialog contains three tabs: Parameters, Statistics, and Charts. The "Parameter” button and the "Charts” buttons in the Roughness Analysis pane opens the Parameter dialog with the Parameters tab in front or the Charts tab in front, respectively. The user is free to switch between tabs once the dialog is open.
Parameters
In the Parameters tab all parameters for a given collection or standard are organized in a tree, where they can be toggled on or off, individually or at group level at the nodes of the tree. For each parameter the preferred unit and the preferred number format can be selected. Selection of unit and number format is also possible at group level.
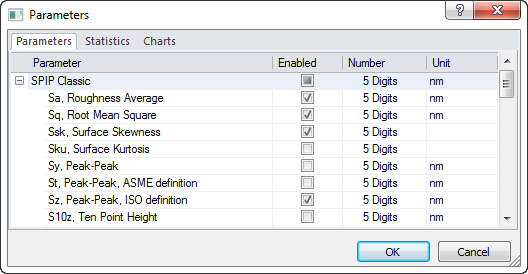
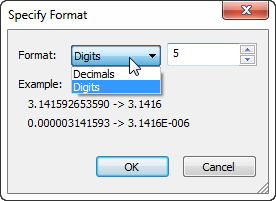
The number format dialog is opened by clicking the ellipses in the Number column. It is possible to choose between number of decimals and number of significant digits. Most topographic measurements tools has a lower resolution limit which sets the ultimate precision, which again can be very different from the tool's accuracy. For the ISO standards (profiles only) the default number format is 3 Decimals in µm units (for length quantities). For the all-round SPIPClassic parameter collections the default is 5 significant Digits and units in nm.
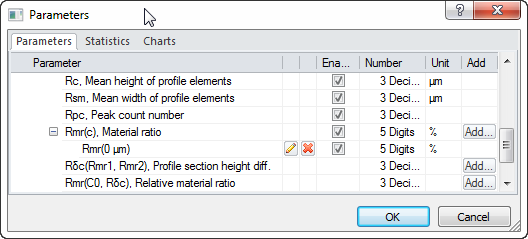
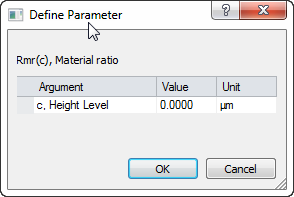
For the ISO 4287 standard for profiles, some parameters have arguments. It is possible to have several instances of the same parameter with different arguments. Before such parameters can be toggled on/off, each instance has first to be added by clicking the Add button for the relevant parameter. Each instance can be deleted or modified later on by clicking the button with the red cross or pencil, respectively.
Parameters with arguments
Editing of a parameter argument
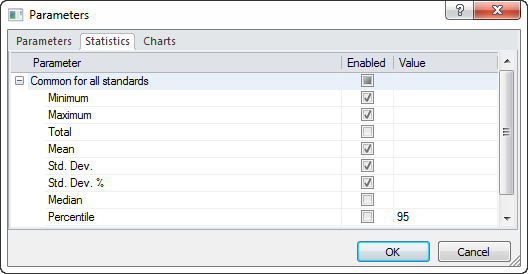
Statistics
On the Statistics tab it is possible to specify which statistical quantities should be reported in the Roughness Result pane when analyzing collections of profiles. The choice of statistical quantities also determines what is reported in the Active Report item "Roughness Result Grid” when multiple images or profiles are analyzed using a Batch Processing sequence.
Statistics selection for analysis of profile collections and for Batch Processing.
Charts
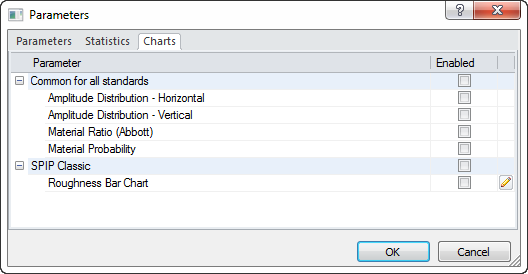
For images a range of charts are available. For descriptions please see the Reference Guide. In the Charts selection dialog it is also possible, perhaps a bit illogical, to enable display of roughness parameters inside the image window. For profiles there are four charts, which are common to all standards, which is the amplitude (height) distribution displayed either horizontally or vertically and then the integrated height distribution (Material Ratio) shown with either linear probability axis in % or a non-linear probability axis in normal standard deviations. Only for the SPIP™ Classic standard there is an additional chart, namely the Roughness Bar Chart.
Charts selection for images
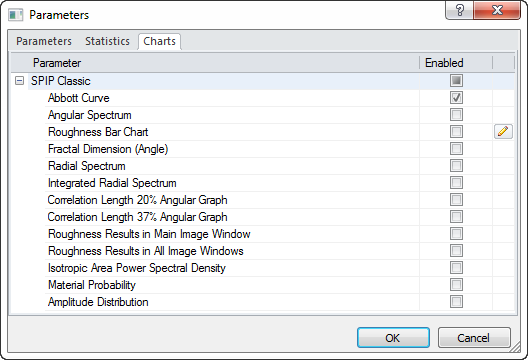
Chart selection for profiles
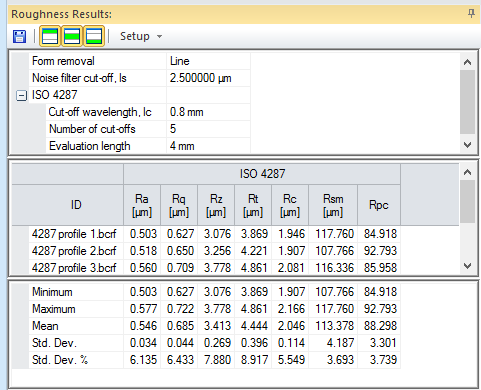
The Roughness Results pane
The Roughness Results pane shows the calculated roughness parameters from the data window which currently has focus – if there is anything to display. Otherwise it displays the results of the most recently selected image or profile window which has roughness data. Initially the pane shows up docked in the bottom of the SPIP™ application window. If the Shape Measurements results pane is already displayed they will be docked together as tabs. The Roughness Results pane contains the same three sections as the Shape Measurements pane, and generally works the same way though it is a bit simpler, see below *). In the case where a single image or profile has been evaluated the Statistic section will be hidden, saving screen space.
In order to be able to copy-paste roughness results in the same way as in earlier SPIP™ versions, where the parameter results were organized as rows in a spreadsheet, it is possible to copy-paste results in transposed mode. This is useful when there is only one result row (for example for images) and one wants to paste into a compact table in a text document. A description on how to organize the results from the result spreadsheet is described in the Result Panes section.
*) The order of columns is fixed, because parameters are grouped within standards. Mixing them around would easily lead to confusion. Unlike the Shape Measurements pane which holds results both from Particle&Pore Analysis and from manually created Measure Shapes the Roughness Results pane only contains results from roughness calculations. Therefore all setup is concentrated in the Roughness Analysis pane.